Your first query
Connect to a database and run your first SQL query.
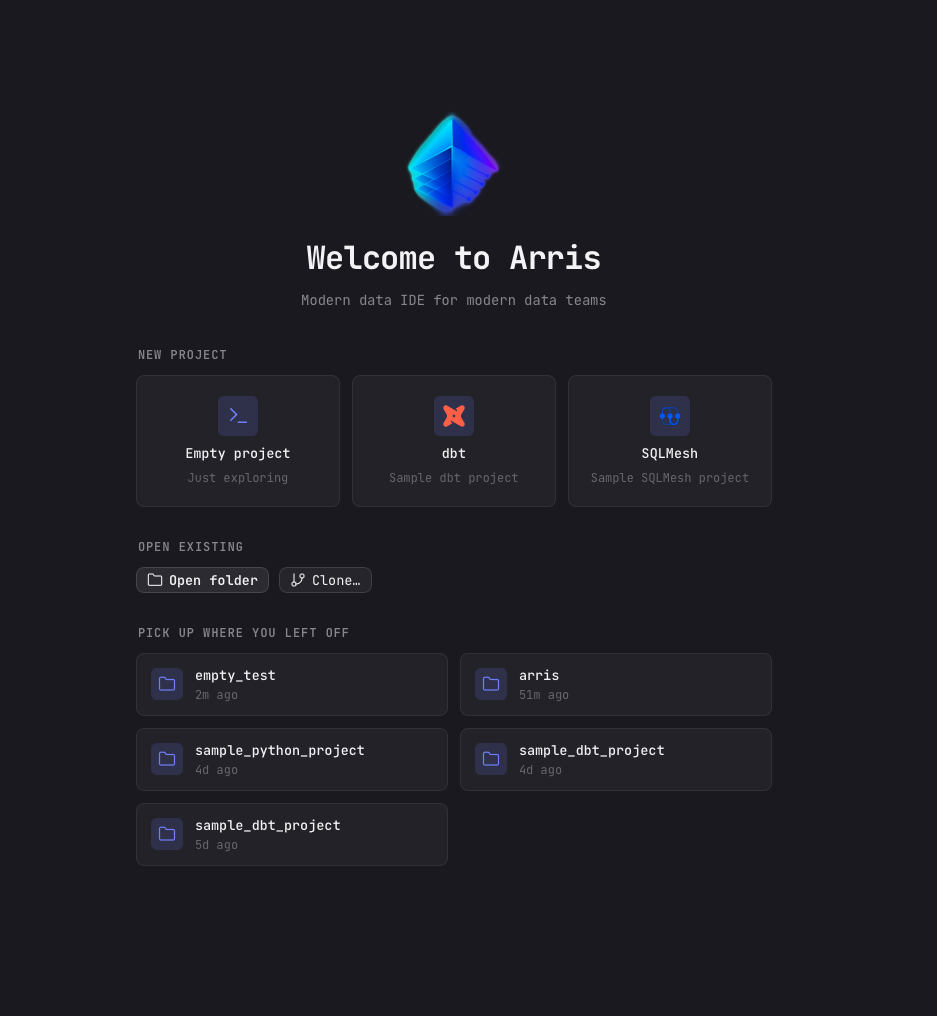
Create an empty project
On the Welcome screen, click Empty project under New project.
Arris scaffolds a fresh workspace and drops a sample.duckdb database with sample
data inside, so you can start querying right away without configuring a connection.
Write a query
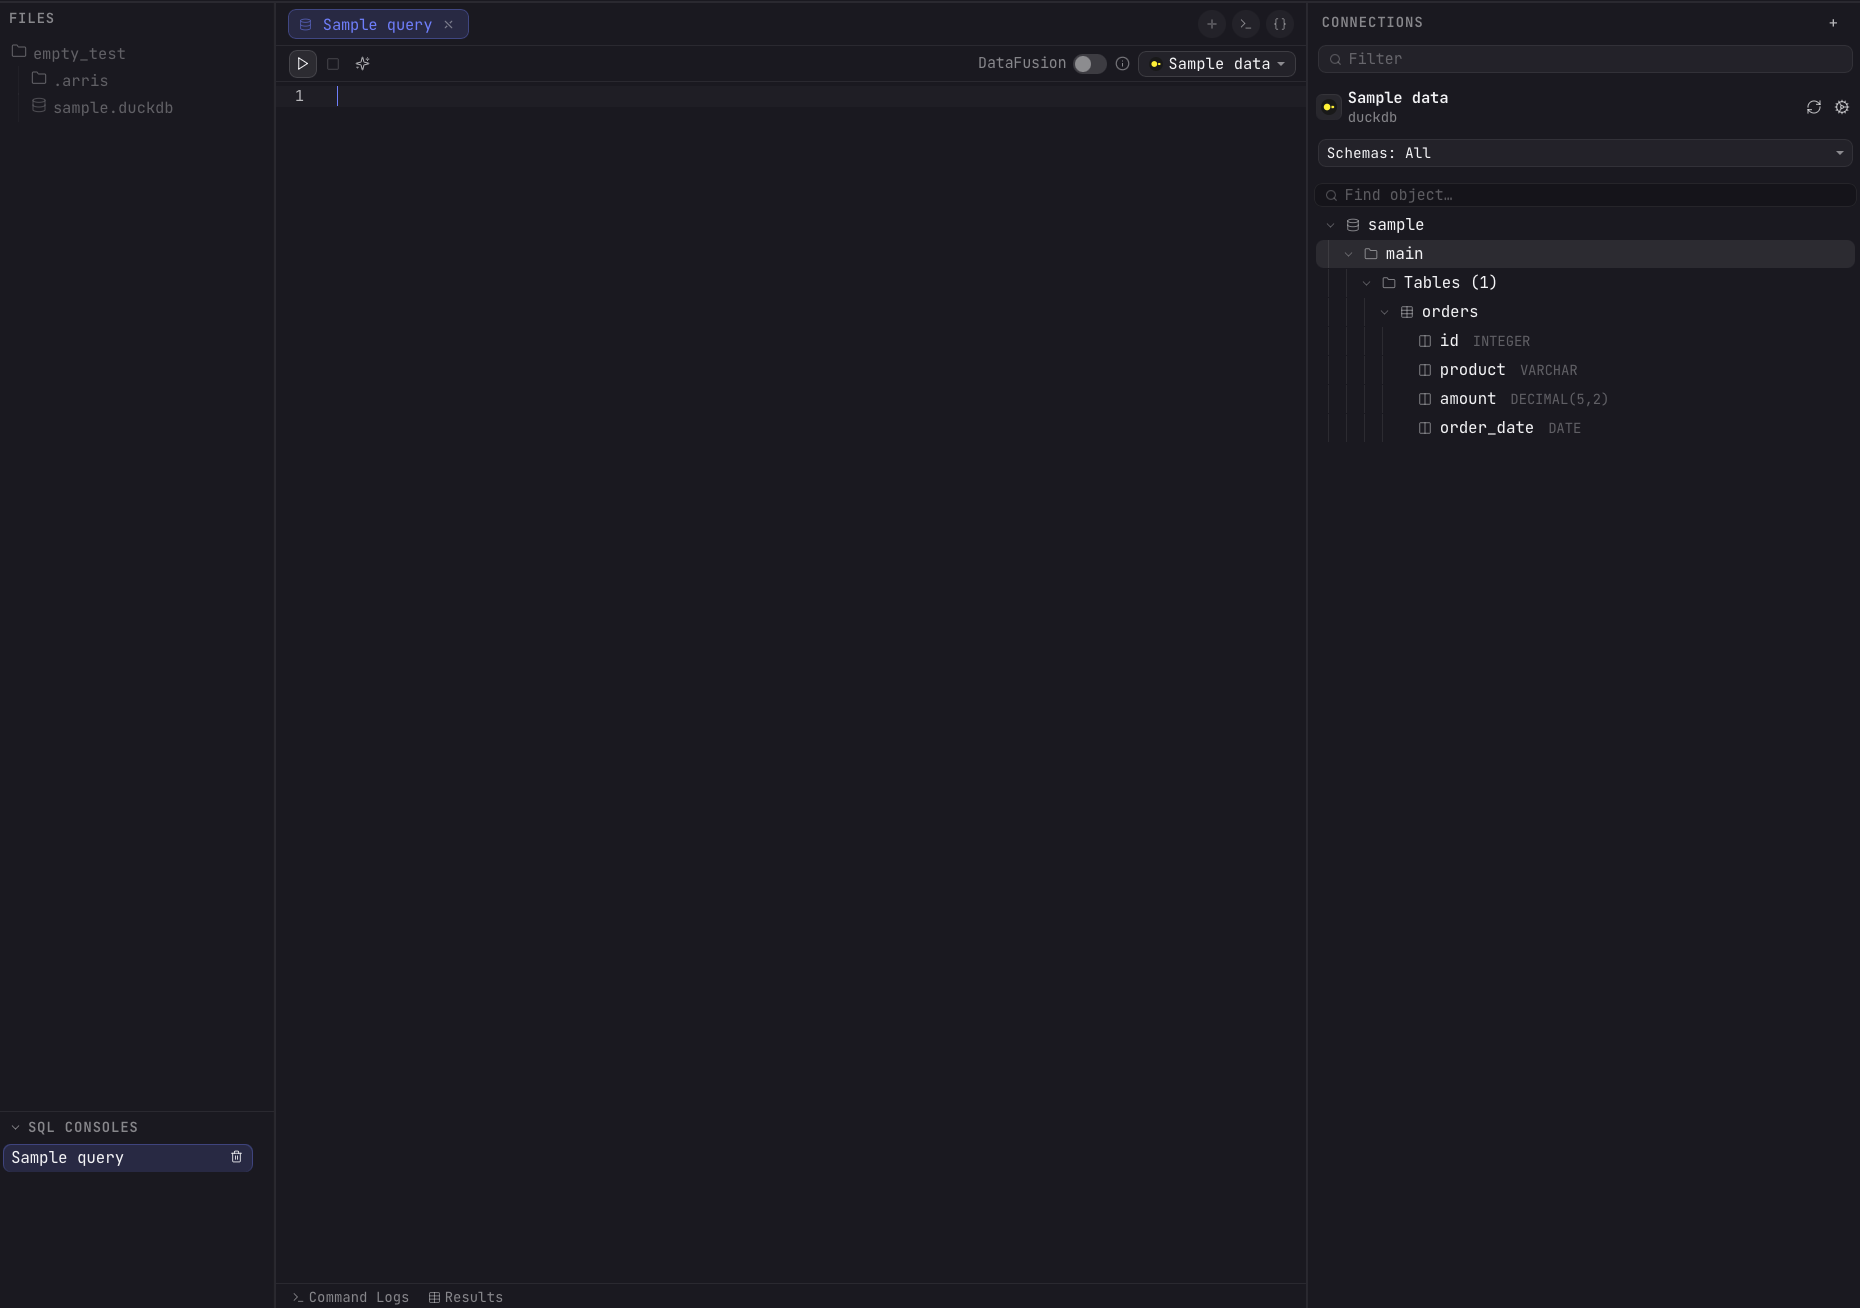
The empty project opens with a Sample query tab already wired to the bundled
Sample data DuckDB connection. Expand it in the right sidebar to browse the
sample orders table and its columns (id, product,
amount, order_date).
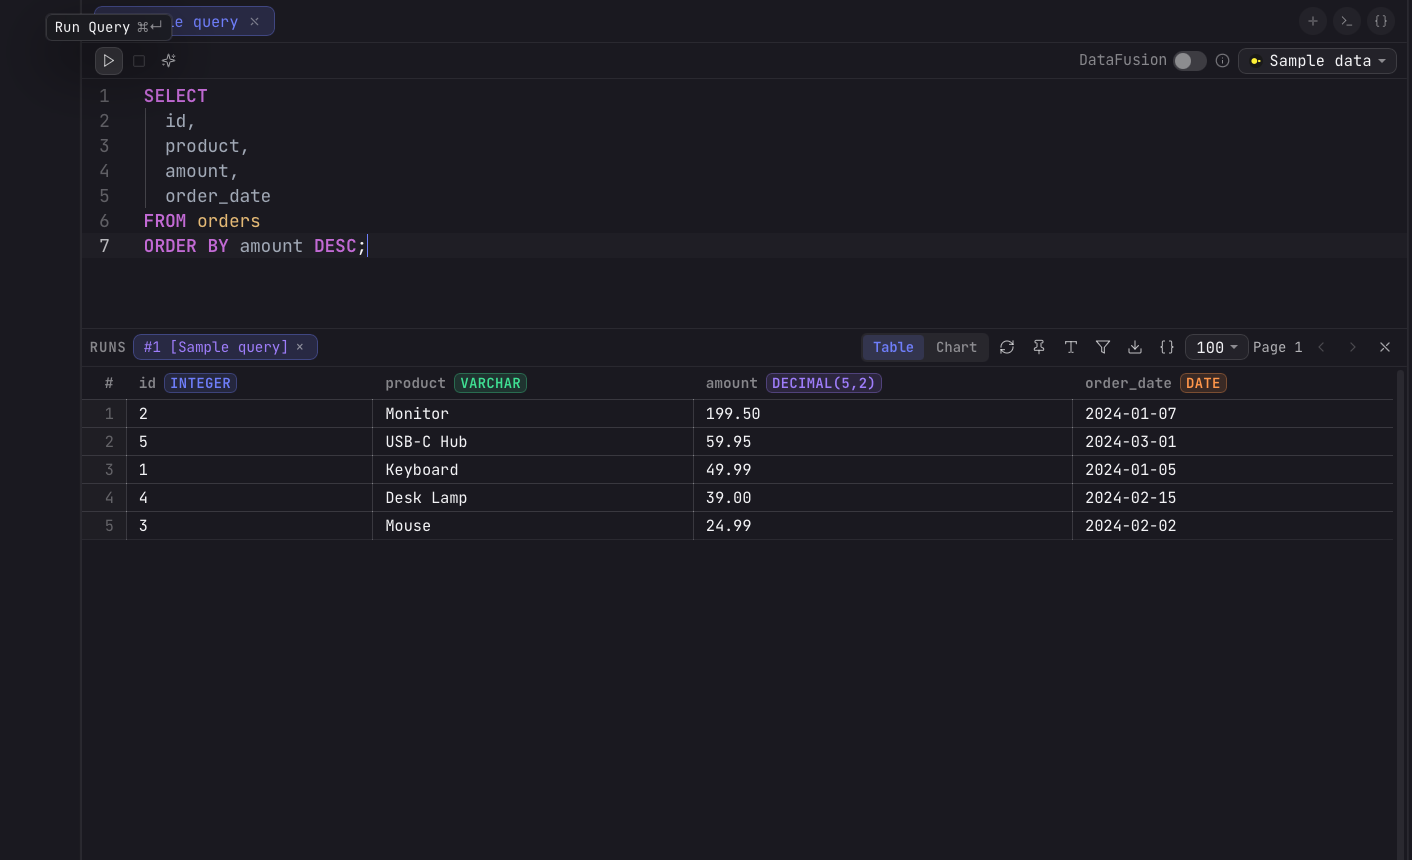
Run it
Click the Run button (the ► icon in the top-left of the editor) or press ⌘↩ to execute the query. To run only part of the script, select the lines you want first. Results appear in the panel below, with each column's name and type in the header.
Browse results
Query results appear in a grid below the editor. The grid supports:
- Sort: click any column header to sort ascending or descending.
- Filter: use the filter bar above the grid to narrow results by column values.
- Copy: select cells or rows and press ⌘C to copy as tab-separated text.
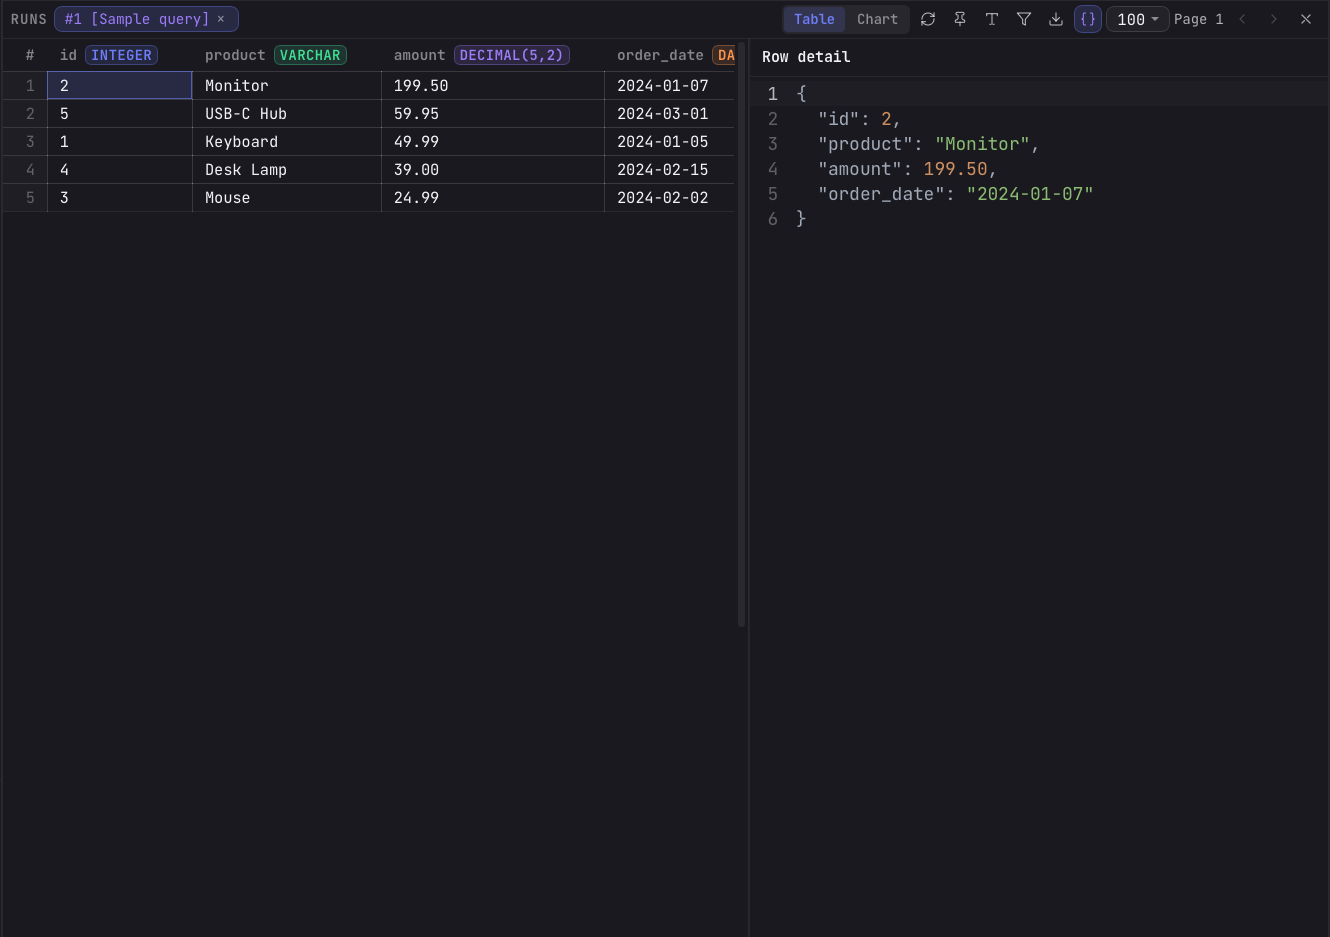
- Row detail: click the { } button in the results toolbar to open the selected row as formatted JSON.
- Export: right-click the grid to export results as CSV or JSON.
- Resize columns: drag column borders to resize, or double-click to auto-fit.
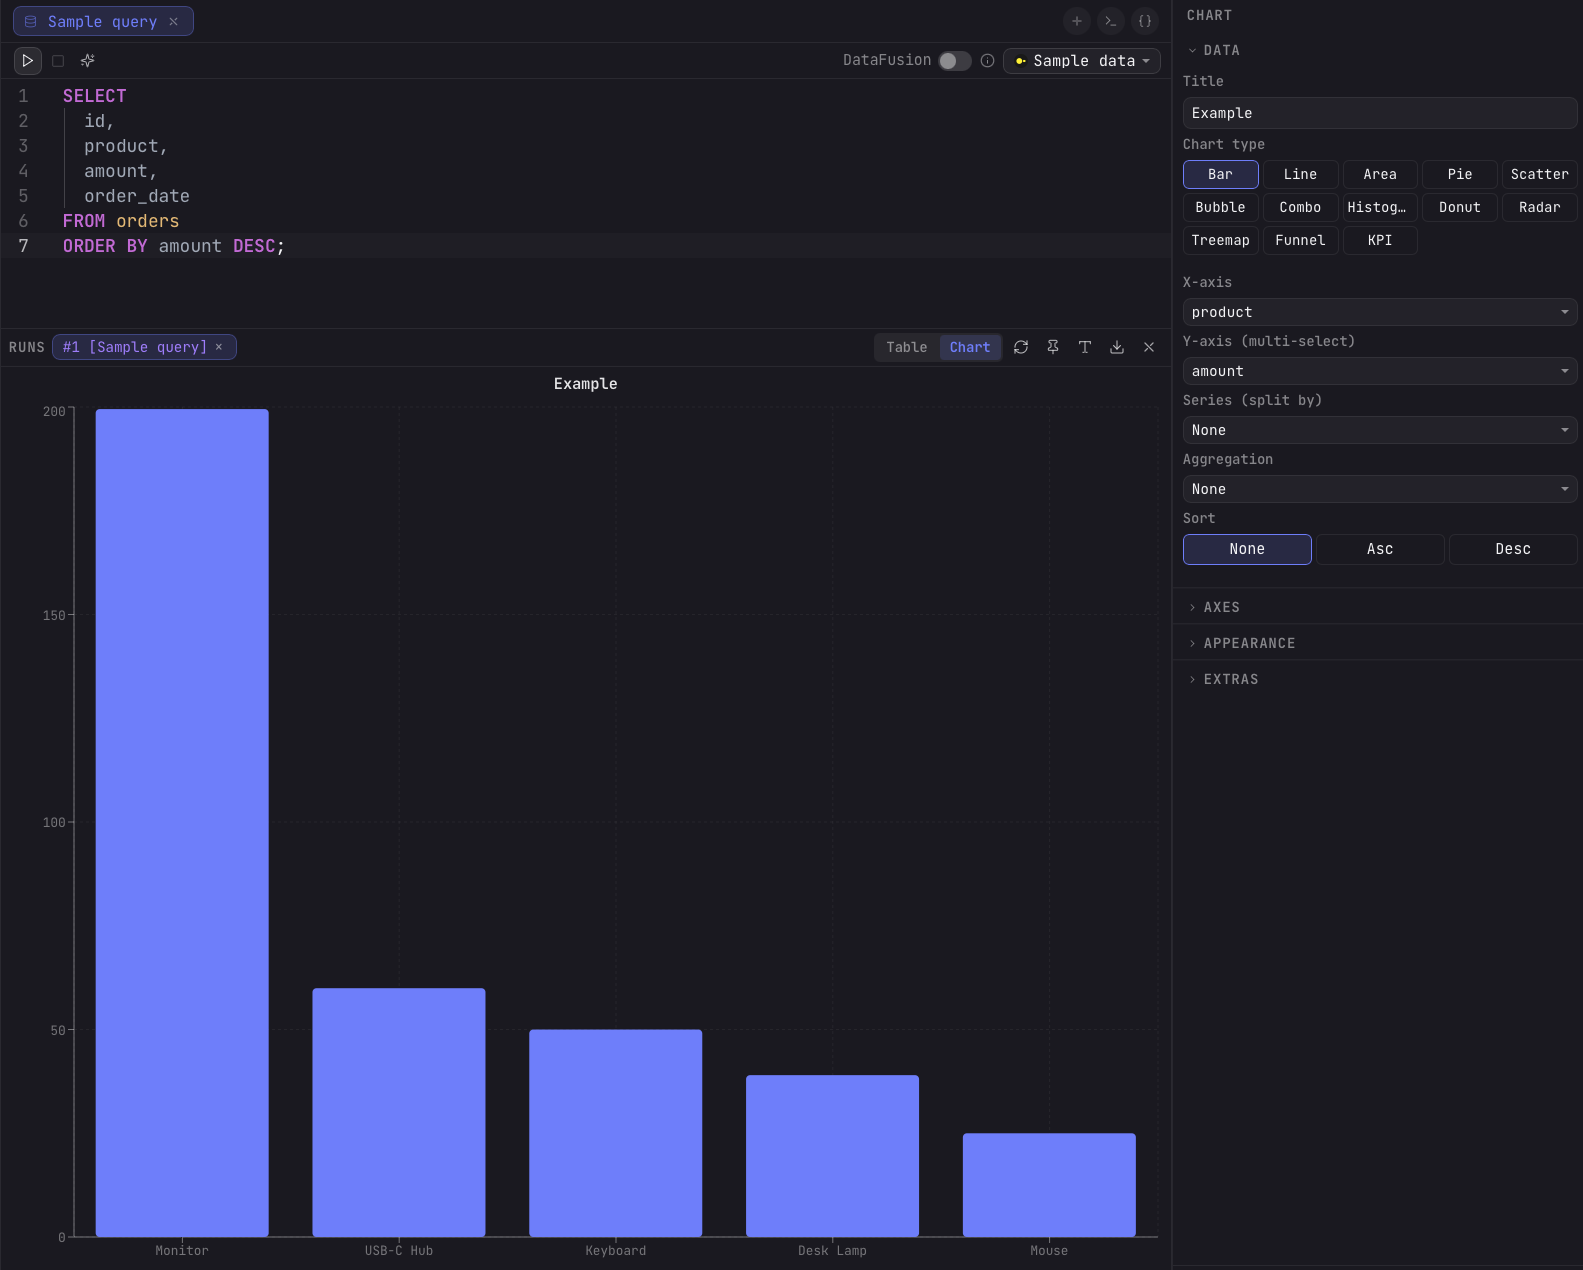
Prefer a visual? Switch the results panel from Table to Chart to plot the same query output without leaving the editor. Pick a chart type (bar, line, area, pie, scatter, and more), map the X and Y axes, and Arris renders it live.
Next steps
You have connected to a database and run your first query. Here are some things to try next:
- Explore the editor features including schema autocomplete and statement-at-cursor execution.
- Try a cross-source federated query to join data from multiple databases.
- Open a dbt project to explore models and lineage.
- Learn the keyboard shortcuts to navigate faster.