dbt
Create, open, browse, run, compile, document, and trace dbt models directly from Arris.
Creating a project
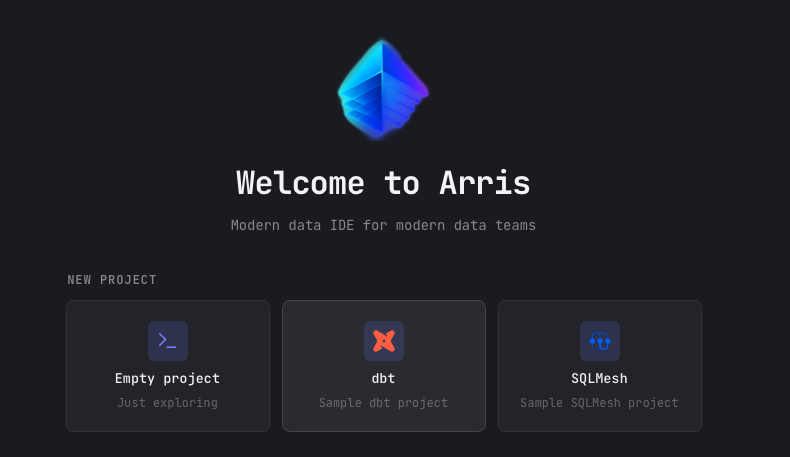
Start a new dbt project from the welcome screen. Under NEW PROJECT, click the dbt card (Sample dbt project). Arris asks for a Project name and a Location (use the folder button to browse), then Create scaffolds a ready-to-run project in a new folder under that location.
The scaffold writes a minimal dbt_project.yml, a profiles.yml wired to
a local DuckDB target so the project runs with no external database, and one example model at
models/example_model.sql. Arris opens the project as soon as it is created, so you
can run dbt run against the sample model immediately and bind a real database later
from the Connection picker.
Opening a project
To open an existing project, use OPEN EXISTING on the welcome screen and pick
the folder that contains your dbt_project.yml. Arris recognizes the
dbt_project.yml marker, scans the project, and reads each node's YAML metadata
(descriptions and column definitions). Once detected, a dbt view becomes
available in the left sidebar.
Until a folder with a dbt_project.yml is open, the dbt view stays empty and prompts
you to open one.
The dbt config pane
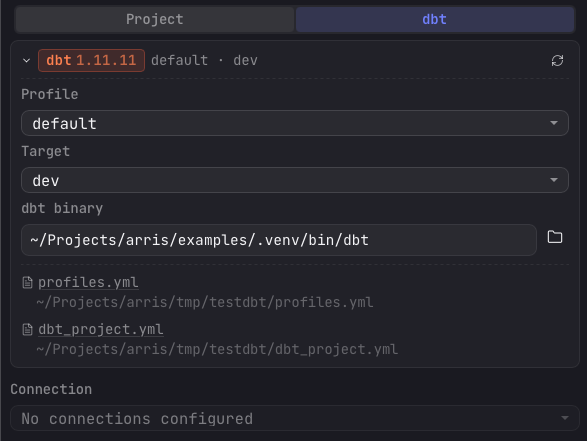
The dbt view opens with a collapsible status card at the top: the dbt badge shows the detected CLI version and a profile · target summary, with a reload button to rescan. Expand it to configure how Arris invokes dbt:
| Setting | What it controls |
|---|---|
| Project | Which dbt root to use, shown only when the folder contains more than one dbt_project.yml. |
| Profile | The profile to run with, loaded from the project's profiles.yml or ~/.dbt/profiles.yml. |
| Target | The output target defined under the selected profile (for example dev or prod). |
| dbt binary | Path to the dbt executable. Defaults to dbt on your PATH; use the folder button to point at a specific install. |
| Connection | A database connection bound to the project, used for model preview and diff against the live table. |
The card also has one-click shortcuts to open profiles.yml and
dbt_project.yml in the editor. If the dbt CLI check fails, the error is shown inline
with a Show full error toggle. Your project, profile, target, and binary
selections persist across sessions.
The dbt view
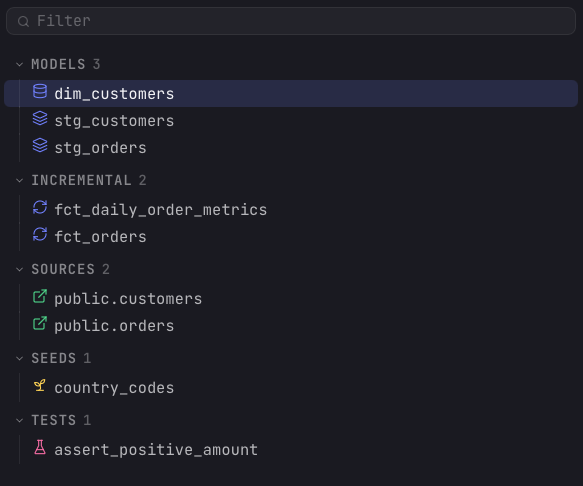
When Arris detects a dbt project, the left sidebar header shows a segmented control to switch the files pane between Project (the raw file tree) and dbt. Click dbt to open the model tree, which lists every node grouped by kind with a count per section:
| Section | What it holds |
|---|---|
| Models | The SELECT statements that dbt materializes as tables or views. The core transformations of the project. |
| Incremental | Models with an incremental materialization, split into their own group so they read distinctly from the rest. |
| Sources | The raw warehouse tables that models read from, read from the sources: blocks in your schema YAML and referenced with source(). |
| Seeds | CSV files in the project that dbt loads into the warehouse as tables, used for small static reference data. |
| Snapshots | Tables that capture how a mutable source row changes over time, recording slowly changing dimension history. |
| Tests | Standalone data tests — the .sql assertion files under your test path — that pass or fail when run. |
| Macros | Reusable Jinja snippets that generate SQL, callable from models to keep transformations DRY. |
| Analyses | Ad-hoc .sql files that dbt compiles but does not materialize, for one-off queries kept under version control. |
Use the filter box to narrow the tree by name. Single-click a node to select it; double-click to open its file in the editor.
Running commands
dbt commands are available in two places. The run bar at the top of the dbt view exposes Run, Test, and Build as a split-button with an editable selector field. Leave the selector empty to run the whole project, or type a node selector to scope the command. The info button next to the bar documents the selector syntax:
| Selector | Meaning |
|---|---|
model | Run a specific model. |
model+ | Run the model and its descendants. |
+model | Run the model and its ancestors. |
@model | Run the model, its parents, and its children. |
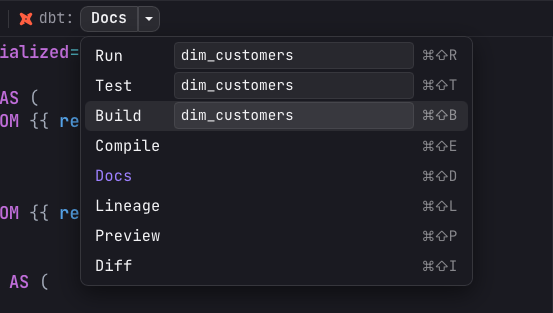
The second place is the dbt toolbar in the editor: open a model and a dbt section appears in the console toolbar. For a model it offers the full set of actions — Run, Test, Build, Compile, Docs, Lineage, Preview, and Diff. For a test file it offers the applicable subset: Test, Build, Compile, and Lineage. The split-button remembers the action you last picked as its primary button, and the selector applies to the run just like in the pane. Preview runs the model's SQL against the bound connection, and Diff compares the model's new output against its production table.
Command logs
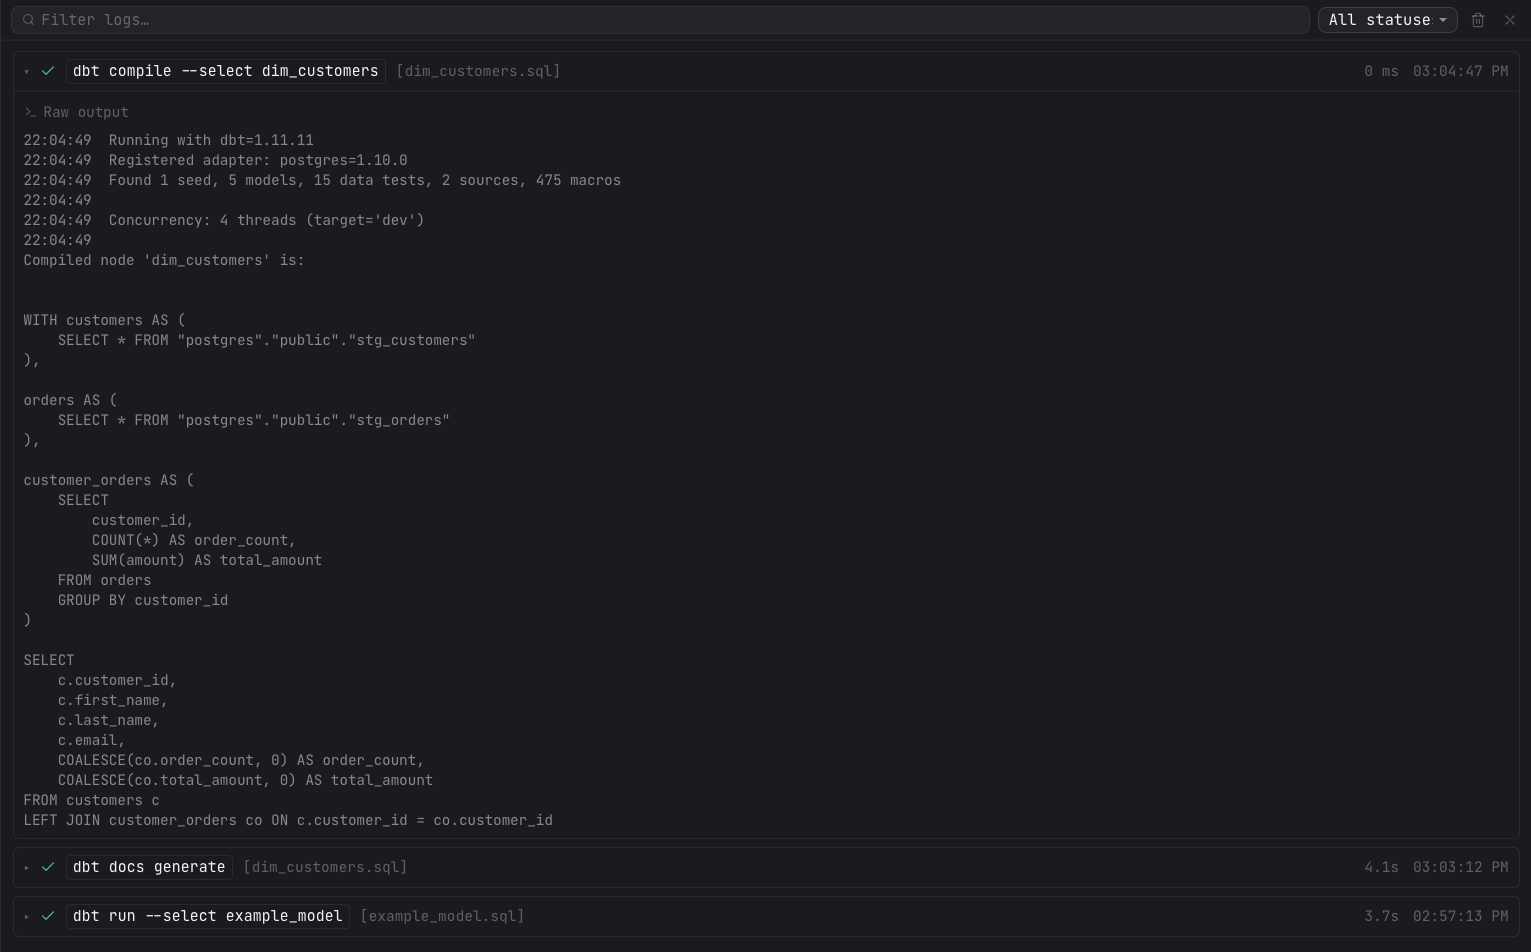
Every command's output streams into the Command logs panel at the bottom of the
window, newest run on top. Each entry records the exact command, its status, duration, and
timestamp, plus a per-node breakdown parsed from dbt's run_results.json (model name,
type, status, and time) and the raw stdout/stderr with ANSI colors preserved. Filter entries with
the search box or the status dropdown, and clear the history with the trash button. See
Command logs for the full reference.
Compiling models
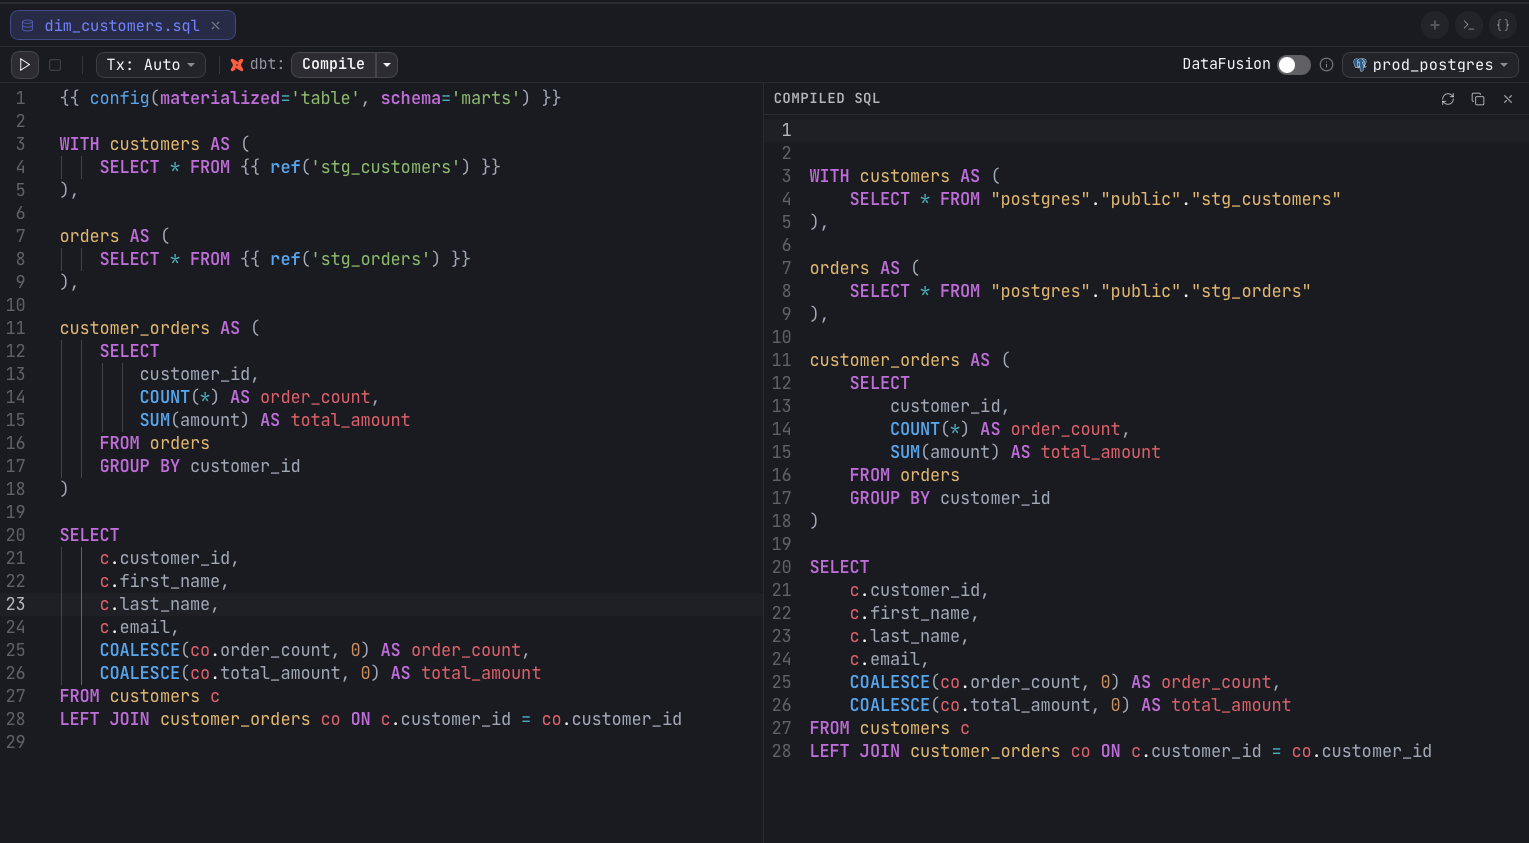
Compile renders a model's Jinja into final SQL and opens a Compiled SQL preview alongside the editor. The preview has buttons to Recompile, Copy SQL, and close it, and it flags a Stale chip when you edit the model after compiling and a Compiling chip while a recompile is in flight. If a compile fails, the preview points you to the error in the command logs below.
Docs
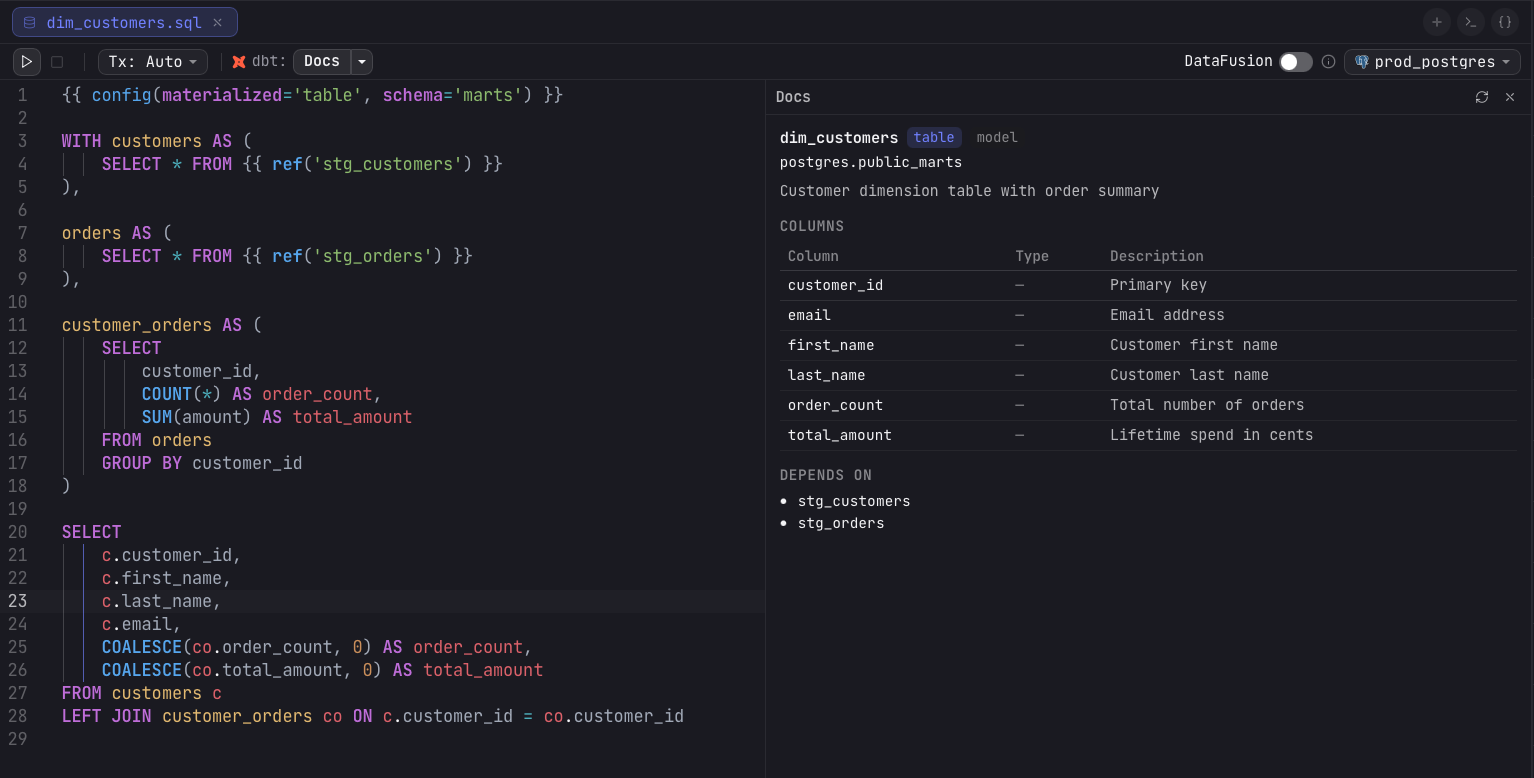
Docs generates the dbt documentation (the manifest.json and
catalog.json artifacts) and renders the current model's docs in a side panel. The
panel shows the model name with its materialization and resource-type badges, the
database.schema relation, the description, a Columns table (name,
type, description), and a Depends on list of upstream nodes. It surfaces a
Stale chip after edits, a Generating chip while running, and a
Regenerate button. If the manifest uses an untested schema version, a warning
notes some fields may be missing.
Lineage
Lineage opens a directed acyclic graph of the model's dependencies, rendered as a draggable node graph. Each node is a model that lists its columns, and the model you opened is marked CURRENT. Toggle it from the Lineage button in the dbt toolbar while a model is open; the graph rebuilds from your current model definitions each time.
For column-level lineage, click a column name inside a node. Arris traces just that column and highlights the upstream and downstream columns it flows through, so you can follow a single field across the graph rather than the whole model.
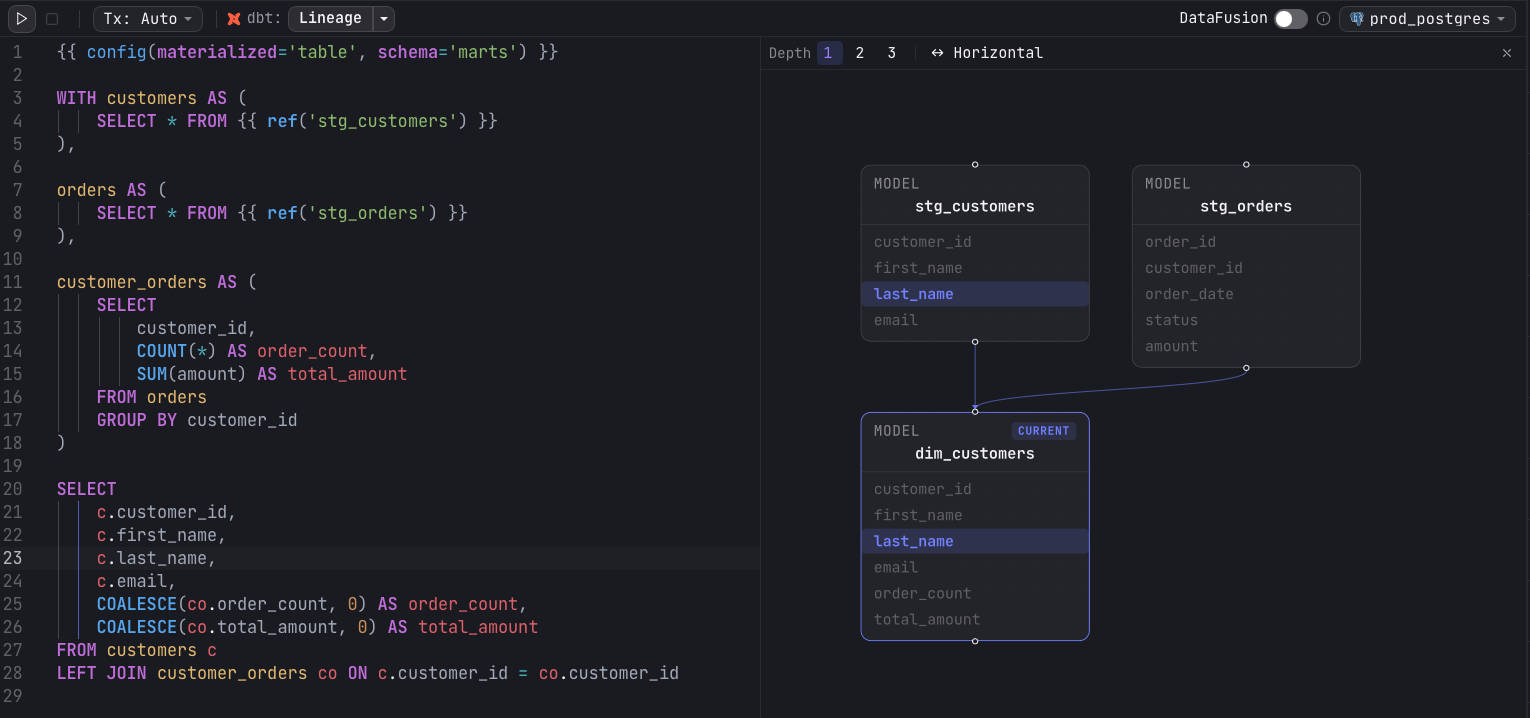
- Depth — choose 1, 2, or 3 to limit how many hops of upstream and downstream models are shown around the current model.
- Orientation — toggle between Horizontal and Vertical layout.
- Pan — drag the canvas background to move the viewport.
- Zoom — scroll, or use the bottom-right controls, to zoom in and out.
- Rearrange — drag any node to reposition it; layout otherwise arranges nodes automatically.
- Open a node — double-click a node to focus that model.
Diff
Diff compares a model's new output — the version you are editing — against the table already in production, so you can see exactly what a change does to the data before you run it. It needs a database connection bound to the project; today the diff targets Postgres and DuckDB, and other dialects show a notice instead. Toggling Diff in the dbt toolbar opens a config strip below it:
| Control | What it does |
|---|---|
| Compute | Inline (compile) diffs the model's compiled SQL as a subquery without writing anything; Materialize (temp table) writes the new side to a temporary table first, which is steadier for heavy models. |
| Sample rows | How many differing rows to pull into each sample grid. Defaults to 50; the counts above the samples are always exact. |
| Primary keys | Optional comma-separated key columns (for example id, region). They switch the diff from a row-set comparison to a keyed one — see below. |
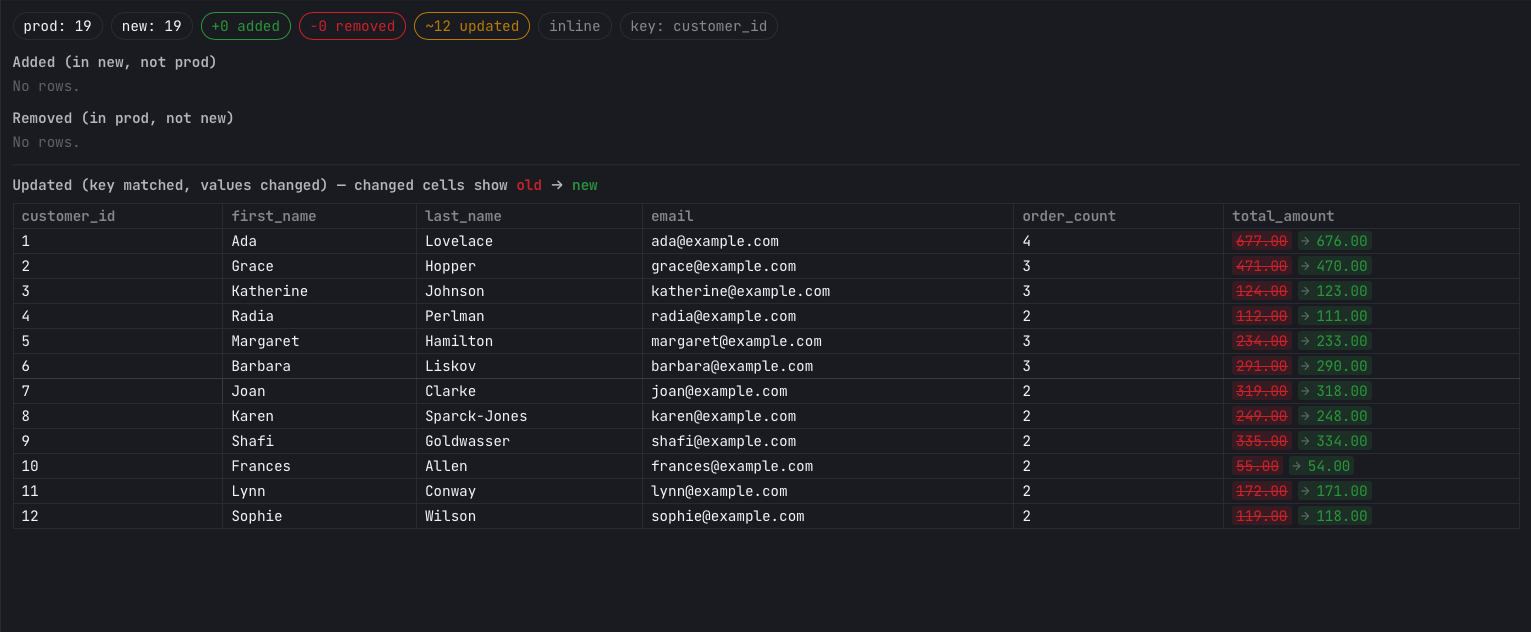
Press Run diff and the result renders in the bottom results pane. How it counts changes depends on whether you supplied keys:
- Keyless — with no primary keys, Arris does a full-row set difference (
EXCEPTboth ways). A row whose values changed shows up as one removed plus one added, and there are no “updated” rows. - Keyed — with primary keys, rows are matched by key, so a value change counts once as updated rather than as a remove plus an add.
The summary line shows the prod and new row totals and chips for +added, −removed, and (when keyed) ~updated, plus the compute mode and key columns. A schema-change line lists any added or removed columns. Below it, sample grids list Added (in new, not prod) and Removed (in prod, not new) rows; for a keyed diff, an Updated grid shows each changed cell inline, git-style, with the old value struck through in red and the new value in green.